
Victoria’s climate has changed in recent decades, becoming warmer and drier. These changes are expected to continue. Our report explores the impacts of these changes in a marine and coastal context.
None of the climate and climate change impacts indicators were assessed as having a good status. Deteriorating trends were observed for 21 of the 22 regional indicators where the trend was assessed.
Sea level rise
Sea-level rise is one of the biggest threats associated with climate change to coastal areas. Tide gauges can tell us about long-term changes in sea level. Measurements show that sea levels have been rising by about 1.8 cm per decade at Williamstown since 1981. They have also been rising 3.5 cm per decade at Stony Point since 1981. Future rises in sea level are projected with high confidence.
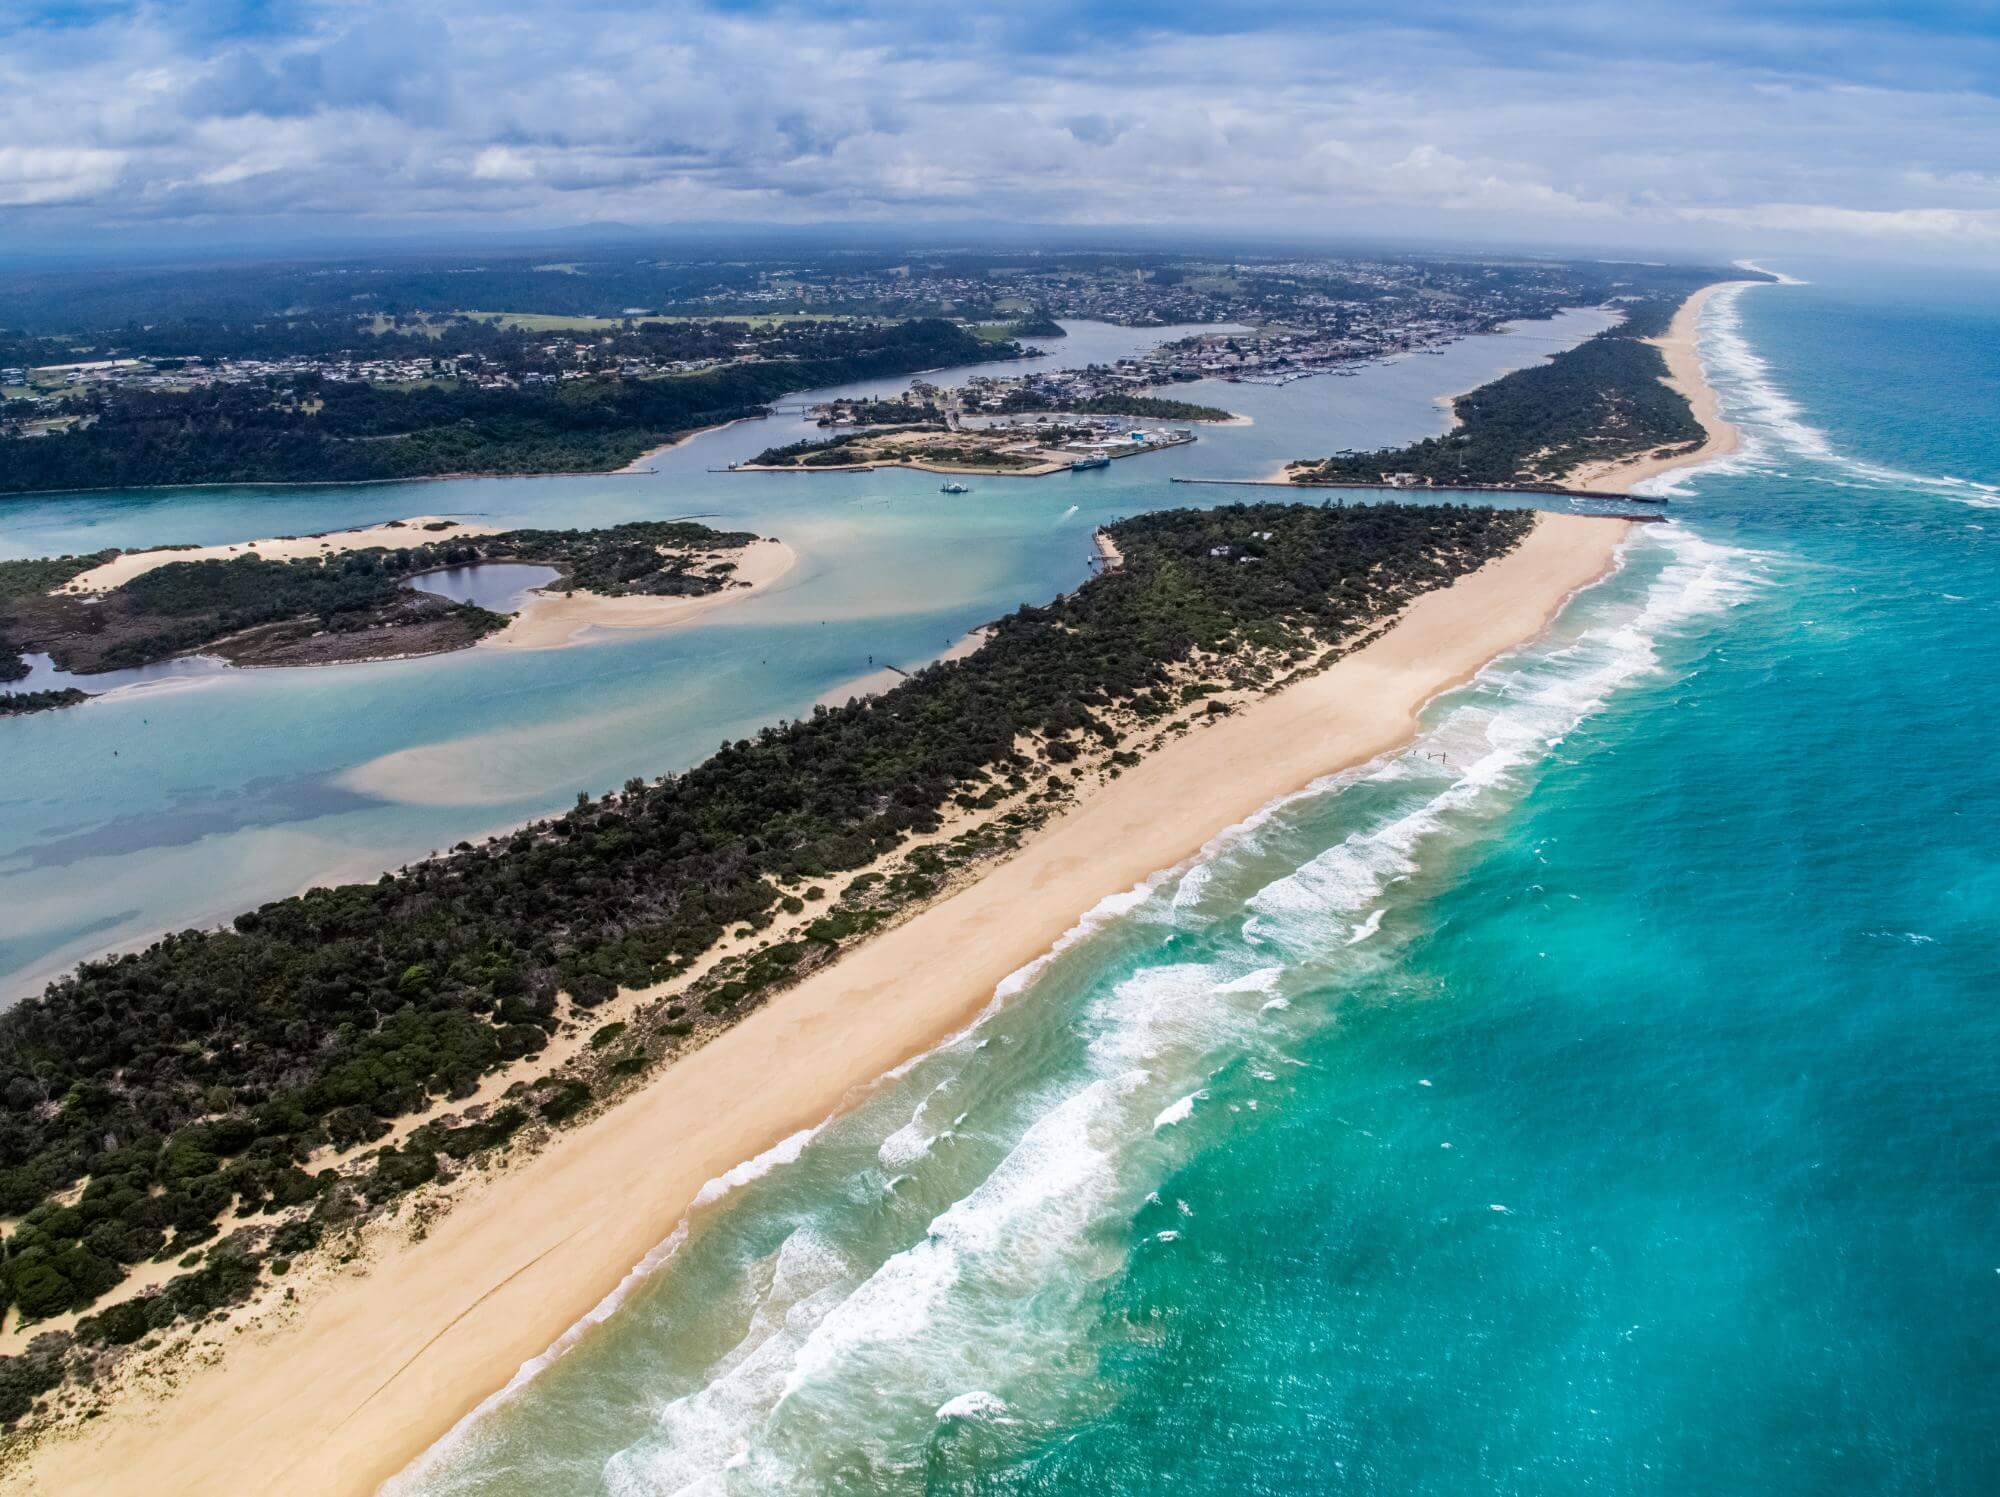
Coastal erosion
Beaches are dynamic landform systems which are in a constant state of flux as they interact with waves breaking on the shore. Erosion on a beach occurs when sand is moved from one location to another. It is a natural process. Yet, rising sea levels due to climate change are likely to cause accelerated erosion of many Australian coastlines.
Research published in 2020 studied the shoreline position of the Victorian coast. Significant changes were found in 13% of the Victorian coast between 1986 and 2017. The study looked at ‘erosion hotspots’, defined as a shoreline retreating by more than half a metre per year. The researchers estimated that erosion hotspots extend over 76.6 kilometres of the coastline. This is equivalent to about 6.2% of the Victorian coast.
In 2017, an erosion vulnerability assessment focused on the Gippsland coastline. It rated more than 100 kilometres of this coastline as having a very high vulnerability to coastal erosion. This means that more than a quarter of the entire Victorian coastline most at risk to erosion is located along the Gippsland Lakes.
Air temperature
Victoria’s climate has been warming since the 1950s, with the scale of the warming more pronounced this century. By the 2050s, average temperatures in Victoria are projected to be:
- 1.4 to 2.4°C warmer under a high emissions scenario or
- 0.9 to 1.8°C warmer under a medium emissions scenario compared to 1986–2005.
By the 2090s, average temperatures in Victoria are projected to be:
- 2.8 to 4.3°C warmer under a high emissions scenario or
- 1.3 to 2.2°C warmer under a medium emissions scenario compared to 1986–2005
Victoria’s coastal regions are likely to have already warmed by more than 1°C. Areas of the Port Phillip Bay coastline now regularly experience years with temperatures about 1.5 degrees warmer than an indicative pre-industrial era baseline.
Marine heatwaves
In recent years, marine heatwaves have increased in frequency around Australia. This has caused permanent impacts on marine ecosystem health, marine habitats and species. These impacts include depleting kelp forests and seagrasses. Some marine species are also experiencing a poleward shift and more disease. A 2019 international study identified the ocean off southeast Australia as being particularly vulnerable to marine heatwaves.
Rainfall
Fluctuating pressure is being placed on the water resources and agricultural sectors. We are experiencing wetter years interspersing a predominately drying climate. Rainfall reduction during the cool seasons is particularly important. It can adversely impact stream flows and reduce reliability for water storage filling seasons.
A 7-12% reduction in annual rainfall has been observed along the Port Phillip Bay coastline during the 21st century. A 13-20% reduction in cool-season rainfall has also been observed. Notably, the biggest percentage rainfall reductions have occurred on the western side of Port Phillip Bay. This area is projected to have faster population growth in coming decades, placing increasing pressure on water resources.
Gippsland Lakes
Corner Inlet and Nooramunga
Western Port
Port Phillip Bay
Data source: BoM, CSIRO, DELWP
Statewide
Gippsland Lakes
Corner Inlet and Nooramunga
Western Port
Port Phillip Bay
Data source: BoM, CSIRO, DELWP
Statewide
Data source: BoM, CSIRO, DELWP
Statewide
Data source: BoM, CSIRO, DELWP
Statewide
Gippsland Lakes
Corner Inlet and Nooramunga
Western Port
Port Phillip Bay
Data source: Academic researchers, DELWP
Statewide
Gippsland Lakes
Corner Inlet and Nooramunga
Western Port
Port Phillip Bay
Data source: BoM
Statewide
Port Phillip Bay
Data source: Academic researchers
Statewide
Gippsland Lakes
Corner Inlet and Nooramunga
Western Port
Port Phillip Bay
Data source: DELWP
Statewide
Data source: Academic researchers
Gippsland Lakes
Data source: Academic researchers
Statewide
Gippsland Lakes
Western Port
Port Phillip Bay
Data source: DELWP, AURIN (Australian Urban Research Infrastructure Network)