On the 7th November 2019, Victoria’s State Government announced a 30-year plan to phase out native forest logging in Victorian public forests by 2030. This includes an immediate logging ban of old-growth forests in Victoria, protecting 90,000 hectares of native forest with an estimated age group of 600 years old. An additional 96,000 hectares will be exempted from logging under the Great Glider Action Statement, a DELWP led strategy to protect the threatened greater glider species and its habitat. The 30-year plan also provides $120 million to upskill and redeploy 1,000 forest industry workers, while providing mills with new equipment for alternative timber processing. VicForests will extend existing timber supply agreements until 2024, after which timber supply will be stepped down before ending in 2030.
A dwindling native timber supply
Harvestable timber reserves in Victoria have halved over the last decade, creating concerns for achieving sustainable native timber production. This is particularly the case for sawlog, which is a high-quality timber extracted from the lower to middle part of the tree trunk. Sawlog is mainly produced from ash forests in Victoria’s Central Highlands region, and has been considerably impacted due to highly variable age structure of Victorian ash forests and minimal hectares of ash forest available for timer production post-1939 age group (see Figure 1). The Victorian sawlog industry currently relies on the 1939 regrowth ash forests. When the 1939 ash forest sawlog supply is exhausted, native forest sawlogs will no longer be available for timber production at least for decades.
Figure 1. Age class distribution of ash forests (Data source: VEAC)

There has been a gradual decline in total timber annual production from state forests over the past two decades, from 729,000 meter cube in 1996–97 to 299,740 meter cube in 2016–17 (Figure 2). Pulpwood production has decreased at a similar rate to sawlog production since 2004–05. From 2012–13 to the present day, overall production of wood products from state forests has been stable although at a lesser amount than 2011.
Figure 2. Annual production of wood products from state forests by sawlogs, pulpwood and other products, 1996-97 and 2016-17 (Data source: VicForests 2018).

Victoria’s native timber sawlog demand and supply balance
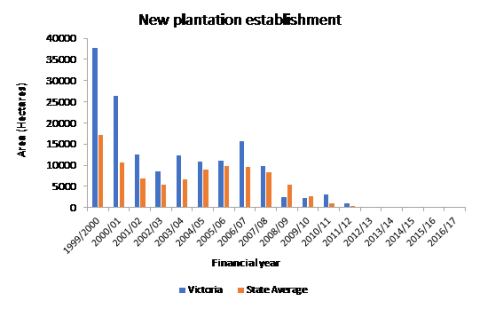
The supply and demand of native timber since 2000 has varied. In 2016-17, there were 421,700 hectares of industrial hardwood and softwood plantations in Victoria (Figure 3). Over the past 18 years, commercial softwood plantation areas have been stable at between 212,000 and 226,000 hectares. By contrast, commercial hardwood plantation areas have doubled in the 10 years since 1999-2000. Plantation areas have gradually decreased by approximately 11,200 hectares since 2010-11, with similar decreases in new plantation establishments from 38,000 hectares in 1999-2000 to no new plantation areas being established since 2012-13 (Figure 4).
The native timber logging ban on public lands will likely result in the unavailability of wood supply from native forests. To address the supply and demand of sawlog needs within Victoria, the State Government will provide an extra 50,000 hectares for timber plantation. This is to be delivered by 2030 to align with the full native logging ban timeline.
Figure 3. Plantation areas in Victoria, 1999 - 2000 to 2016 -17 (Data source: ABARES)

Figure 4. Area of new plantation establishment in Victoria, 1999-2000 to 2016-17 (Data source: ABARES)
Decades are required for plantations to be ready for harvesting and producing high quality sawlogs. Even with the additional 50,000 hectares being established, there will be a sawlog supply gap due to the time needed to realise the production availability of this plantation. Victoria’s plantation industry produced approximately 87% of Victoria’s log volumes during 2017-18. Timber mills that rely heavily on timber supply from VicForests will face timber production supply gaps. To address these business concerns, the Victorian Government has committed funding to upskill and redeployment of mill employees, as well as providing new equipment to current mills to process alternative timbers.
The Victorian domestic demand for sawlogs will increase due to projected population growth over the next decade. This could result in a greater gap between supply and demand for Victoria, with the Australian Bureau of Agricultural and Resource Economics and Sciences forecasting a shortfall in the volume of softwood sawlogs available for the domestic market of 2.6 million cubic metres per year between 2045 and 2049 in Australia.To meet the estimated demand, an additional 200,000 to 250,000 hectares of new softwood plantations are required by 2050.
Reduced employment in Victoria’s forestry industry
Employment trends provide further evidence to the diminishing trend of Victoria’s forestry industry (Table 1). Aside from forestry and logging and forestry support services, employment in the forestry sector is proportionally decreasing. As a result, Victoria is becoming less dependent upon the forestry industry than a decade ago.
Table 1. Employment by forestry industry sector in Australia and Victoria, 2006, 2011 and 2016. (Data sources:ABARES and ABS)
|
Australia |
Victoria |
|||||
|
Year |
2006 |
2011 |
2016 |
2006 |
2011 |
2016 |
|
Forestry and logging |
6,866 |
5,403 |
6,028 |
1,177 |
1,065 |
1,371 |
|
Forestry support services |
2,050 |
2,171 |
2,956 |
338 |
418 |
569 |
|
Pulp and paper product manufacturing |
23,482 |
19,368 |
13,969 |
8,893 |
8,164 |
5,660 |
|
Timber wholesaling |
5,533 |
4,673 |
4,566 |
1,704 |
1,641 |
1,610 |
|
Wood product manufacturing |
47,304 |
41,669 |
29,032 |
10,897 |
10,348 |
7,525 |
|
Total in forest industry sector |
85,235 |
73,284 |
56,551 |
23,009 |
21,636 |
16,735 |
|
Total employment of all industries |
10,299,500 |
11,323,200 |
11,957,700 |
2,551,200 |
2,830,900 |
3,102,300 |
|
Forestry dependencyB |
0.83% |
0.65% |
0.47% |
0.90% |
0.76% |
0.54% |
A. % Victoria is a proportion of employment in Victoria in each sector compare to the employment of each sector in Australia.
B. Forest dependency is total in forest industry sector divided by total employment of all industries.
Forestry tertiary education
Tertiary education trends provide a window on the future of Victoria’s forestry industry. The State of the Forests 2018 Report demonstrates that enrolments in forestry training packages in Victoria dropped by 73% between 2009 and 2016. The only industry qualification that showed a growing demand was timber merchandising, where enrolments saw a four-fold increase. However, this qualification is not directly related to forestry industry operations. The greatest decline in tertiary education enrolments was in forest growing and management, which decreased by 1122. Since 2013, enrolments for wood panel and board production qualification have been zero.
The sharp decline of enrolments in forestry courses, employment in forestry sector and dwindling native timber supply indicates that the forestry industry has been shrinking while the overall industry in Victoria has been expanding (Table 2).
Table 2. Forest training package enrolments in Victoria, 2009-2016. (Data source: Industry Skills Scans)
|
Industry qualification |
Enrolments |
% Change |
|||||||
|
2009 |
2010 |
2011 |
2012 |
2013 |
2014 |
2015 |
2016 |
||
|
Forest growing and management |
1555 |
1174 |
1146 |
163 |
234 |
322 |
215 |
433 |
-72 |
|
Harvesting and haulage |
498 |
480 |
326 |
148 |
94 |
23 |
54 |
44 |
-91 |
|
Saw-milling and processing |
427 |
389 |
201 |
107 |
120 |
139 |
124 |
93 |
-78 |
|
Timber manufactured products |
110 |
78 |
91 |
99 |
115 |
82 |
54 |
39 |
-65 |
|
Wood panel and board production |
38 |
30 |
80 |
77 |
0 |
0 |
0 |
0 |
-100 |
|
Timber merchandising |
39 |
64 |
36 |
29 |
24 |
34 |
161 |
201 |
415 |
|
Pulp and paper manufacturing |
393 |
458 |
113 |
301 |
179 |
19 |
10 |
26 |
-93 |
|
Total |
3060 |
2673 |
1993 |
924 |
766 |
619 |
618 |
836 |
-73 |
The insight provided in this article is based on evidence from the State of the Forests 2018 Report that can be found here.
References
ABS, ‘2016 Census’, Canberra, Australia.
Australian Department of Agriculture and Water Resources (ABARES), ‘Australian forest and wood products statistics’, Canberra, Australia http://www.agriculture.gov.au/abares/publications/pubs?url=http://143.188.17.20/anrdl/DAFFService/pubs.php%3FseriesName%3DAustForestStat%26sort%3Ddate%26sortOrder%3Ddesc%26showIndex%3Dtrue%26outputType%3Dlist%26indexLetter%3D_Accessed 10 January 2019.
Australian Department of Agriculture and Water Resources ABARES 2018, ‘Australian forest and wood products statistics: September and December quarters 2017’, Canberra, Australia http://data.daff.gov.au/data/warehouse/9aaf/afwpsd9abfe/afwpsd9abfe20180524/AFWPSOverview_Sep-Dec_2017_v1.0.0.pdf Accessed 4 December 2018.
Australian Department of Agriculture and Water Resources ABARES 2007, ‘Australian forest and wood products statistics: September and December quarters 2006’, Canberra, Australia http://data.daff.gov.au/data/warehouse/pe_abare99001363/afwps06.2_sept__dec06.pdf Accessed 4 December 2018.
ForestWorks, ‘Industry Skills Scans’, Melbourne, Victoria http://www.forestworks.com.au/publications/industry-skills-scans/
VEAC 2017, ‘Fibre and wood supply: Assessment report’, Melbourne, Victoria.
Whittle L, Lock P, Hug B 2019, ‘Economic potential for new plantation establishment in Australia: Outlook to 2050’, Research report 19.4, Australian Department of Agriculture and Water Resources (ABARES), Canberra, Australia.